Cloud cost control is a capability you grow, not a dashboard you buy. The maturity ladder from raw visibility to unit economics — and the practices on each rung.
Share
The FinOps maturity ladder
Each rung is a capability you earn before the next one pays off. Skipping a rung is how cost programmes stall.
Cost maturity
From one unowned bill to cost per request — the right-hand label is the FinOps phase
No allocation
One cloud bill, nobody owns the line items
Crawl
Cost visibility
Spend mapped to teams and apps
Inform
Showback
Teams see their costs; no money moves yet
Inform
Optimisation
Rightsizing, commitments, anomaly alerts
Optimise
Unit economics
Cost per customer, per request, per feature
Operate
Most organisations sit between visibility and showback. The goal isn't unit economics for everything — it's the right rung per workload.
The practices that move you up
Click each practice to see the analogy and the lesson from running it at scale.
The foundation
Cost Allocation
"You can't split the restaurant bill if half the dishes have no name on them"
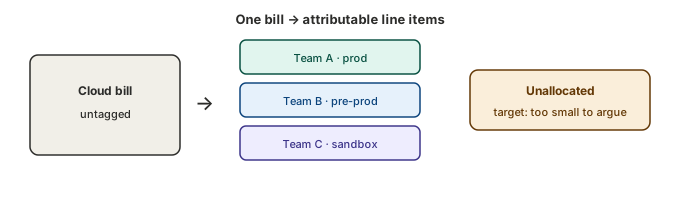
Allocation is the unglamorous foundation everything else stands on: every resource tagged, every cost attributable to a team, app, and environment. Without it, optimisation is guesswork and chargeback is a fight. The target isn't 100% — it's enough coverage that the unallocated remainder is too small to argue about.
Allocation is a tagging-discipline problem dressed up as a finance problem. The fix is to make tags mandatory at provision time — enforced in the pipeline, not chased in a spreadsheet after the fact. Tags applied by hand after a migration are tags that are wrong by month two.
The foundation
Cost Allocation
"You can't split the restaurant bill if half the dishes have no name on them"
Allocation is the unglamorous foundation everything else stands on: every resource tagged, every cost attributable to a team, app, and environment. Without it, optimisation is guesswork and chargeback is a fight. The target isn't 100% — it's enough coverage that the unallocated remainder is too small to argue about.
Allocation is a tagging-discipline problem dressed up as a finance problem. The fix is to make tags mandatory at provision time — enforced in the pipeline, not chased in a spreadsheet after the fact. Tags applied by hand after a migration are tags that are wrong by month two.
Awareness vs behaviour
Showback vs Chargeback
"Showback is the itemised receipt; chargeback is the card actually being charged"
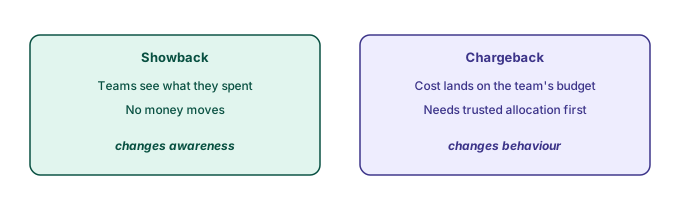
Showback shows each team what they spent — visibility without consequence. Chargeback moves the money: the cost lands on the team's own budget. Showback changes awareness; chargeback changes behaviour. Most organisations should earn the right to chargeback by getting allocation trustworthy first.
Don't jump to chargeback on day one. If your tagging is 60% complete, chargeback just means 40% of the bill lands in a 'shared' bucket nobody trusts — and you'll spend a year arguing about the bill instead of cutting it. Get allocation past ~90% with showback first, then turn on the money.
Discounts with discipline
Commitment Discounts
"A season ticket: cheaper per journey, but only if you actually travel"
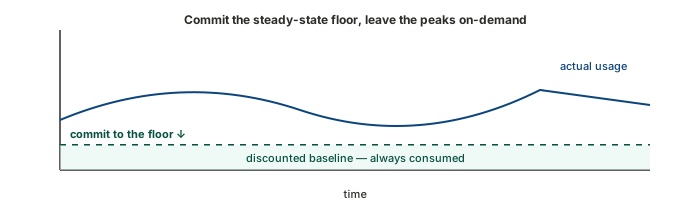
Reserved capacity and committed-use discounts trade flexibility for a lower rate. Used well, they're free money on your steady-state baseline. Used badly, they're prepaid capacity you've stopped using. The discipline is to commit only to the floor of your usage, track utilisation, and alert the moment a commitment stops being consumed.
Centralise the commitment portfolio. When every team buys its own reservations, you end up over-committed in one place and paying on-demand premiums in another. A central view covering the aggregate baseline beats a dozen local guesses.
The honest scoreboard
Forecast Accuracy
"A weather forecast is useful at 90% confidence and noise at 50%"
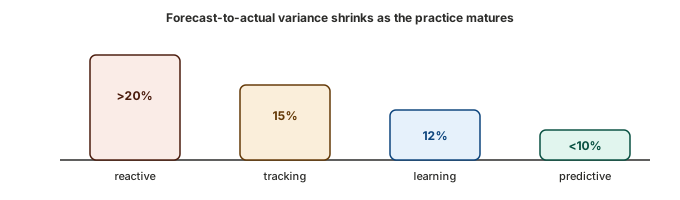
Forecasting turns cloud spend from a monthly surprise into a planned number. Maturity shows up as shrinking variance between forecast and actual — from 'we'll find out at month-end' to a model that learns from prior migrations and flags drift early. The variance figure is the honest scoreboard for the whole practice.
Track forecast-to-actual variance as a KPI and watch it fall as the practice matures — wide and reactive at the start, tight and predictive once you have history to learn from. The number going down is the proof the practice is working.
Shared scoreboard
Engineering Meets Finance
"Not a referee blowing the whistle — two teams reading the same scoreboard"
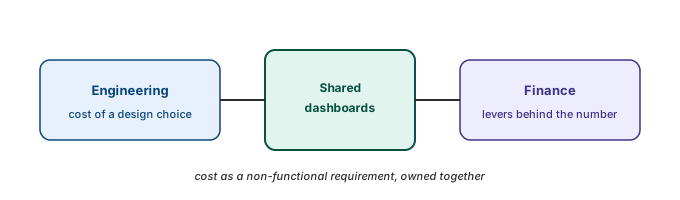
FinOps fails when it's finance policing engineering. It works when engineers and finance look at the same dashboards and own the outcome together — engineers see the cost of a design choice in near-real-time; finance understands the levers behind the number. Cost becomes a non-functional requirement, like latency or security, not an after-the-fact audit.
The cultural shift is engineers caring about cost because it's visible and theirs, not because finance sent an email. Put unit cost next to the deploy, give engineers efficiency KPIs they own, and the optimisation happens without a cost-cutting programme.
Decision framework
Frequently asked questions
What is FinOps maturity?
FinOps maturity is how far a cost practice has progressed from one unowned bill to cost per request. The ladder runs: no allocation, then cost visibility, then showback, then optimisation, then unit economics. Each rung is a capability you earn before the next one pays off, which is why skipping one is how cost programmes stall. It is something you grow, not a dashboard you buy.
Where should a cost programme start?
Allocation, every time. Every downstream practice — showback, chargeback, unit economics — stands on knowing which team, app, and environment each cost belongs to. Until the unallocated remainder is too small to argue about, you are optimising guesses, and optimisation on bad data is theatre. The fix is a tagging-discipline problem dressed up as a finance problem: enforce tags at provision time in the pipeline, not by chasing spreadsheets afterwards.
Showback or chargeback?
Start with showback and earn chargeback. Showback changes awareness; chargeback changes behaviour — but only if teams believe the bill. Turn chargeback on while allocation is still shaky and a large slice of spend lands in a "shared" bucket nobody trusts, and you will spend the year disputing it instead of cutting it. Get allocation comfortably past 90% first, then move the money.
Who should own commitment discounts?
One central portfolio, not each team. Reserved and committed-use discounts pay off against the aggregate baseline, and a dozen local guesses reliably leave you over-committed in one place and paying on-demand premiums in another — discounts on the table and prepaid capacity idle at the same time. Commit to the floor of total usage, track utilisation, and alert the moment a commitment stops being consumed.
Why do FinOps programmes stall?
Usually because cost stayed finance's problem. FinOps as finance policing engineering fails; it works when both sides read the same scoreboard and cost becomes a non-functional requirement like latency or security. Surface unit cost in the tools engineers already use, put it next to the deploy, and give them efficiency KPIs they own — then optimisation becomes routine rather than an annual campaign. Watch forecast-to-actual variance fall as proof it is working.